

The Starbucks Digital team creates and supports innovative technologies and experiences that enhance customer engagement, empower baristas, and bring the brand to life across every digital touchpoint.
DATE
March 2024 - February 2025
*Multiple projects were executed within the one-year timeframe of the team’s broader investigation into print and digital menu processes.
TEAM
Dedicated UX Researcher in the marketer portfolio (myself), UX Designers, Product Managers, Technical Product Manager, UX Design Manager, Creative Operations, Marketing Operations, Engineering Manager, Director of Product, Director of Marketing.
OVERVIEW
At Starbucks, marketers depend on internal tools to manage and update in-store menus, which is an essential process that directly shapes what customers see and how they order. These tools play a critical role in ensuring menu accuracy, operational efficiency, and clear communication across thousands of stores.
My research bridged the gap between these internal workflows and the customer experience. By uncovering usability challenges marketers faced and testing how different menu designs impact customer clarity and decision-making, I helped drive improvements that enhanced both operational excellence and customer satisfaction at scale.

DMB (Digital Menu Board) Portfolio Highlights
OBJECTIVE
Examine the back-end workflow and the front-end experience to improve operational efficiency and customer clarity at scale.
Evaluate how marketers use the internal tool to update menus.
Test how “Sold Out” badge placement on menu boards affects visibility, comprehension, and ordering behavior.
METHODS
Heuristic evaluation & Usability testing: Evaluated key tasks within the internal tools across marketer segments.
PURE Scoring: Measured task efficiency and friction points within marketer workflows.
Concept testing (A/B/C): Assessed discoverability and comprehension patterns for different menu layouts.
Qualitative interviews: Captured mental models and expectations from both regular and irregular customers.
CHALLENGES
While evaluating the internal tools, I had to map and understand how marketers actually use internal tools in their day-to-day publishing process. This foundational work was critical to uncover hidden dependencies, workarounds, and variations in how the tool was applied across teams.
Marketers had varied levels of expertise, making it difficult to design a single intuitive tool.
Inconsistent menu labels and unclear navigation paths were leading to errors/delays in publishing.
RESEARCH INSIGHTS
1. Internal tools experience (Menu Content Builder & Signage Builder)
Before addressing feature-level issues, the research revealed that the underlying publishing process itself was fragmented, often forcing marketers to rely on manual workarounds; Navigation inconsistencies and unclear terminology significantly slowed publishing tasks (broken process).
Lack of menu preview or confirmation steps led to frequent publishing errors, impacting menu accuracy at scale.
PURE scores revealed task friction, especially for less experienced marketers, highlighting structural workflow issues more than isolated UI problems.
2. Customer experience (“Sold-out” badge placement)
Regular customers relied on habitual scanning patterns, often overlooking lower-visibility placements.
Irregular customers benefited from more prominent, standardized placements (e.g., upper-right badge).
A/B/C concept testing showed that clear, consistently placed badges improved comprehension and reduced ordering friction.
RESEARCH IMPACT
Insights from the internal tools usability study directly shaped the redesign roadmap, improving publishing speed, reducing errors, and building marketer confidence; my UX recommendations enhanced information visibility, reduced user effort and error risk, and ultimately delivered over 400 hours of annual time savings for marketing teams.
“Sold-out” badge findings informed future placement and motion guidelines, enhancing menu clarity and transparency.
Clearer “Sold-out” communication reduced customer frustration during peak hours and supported faster decision-making.
By connecting back-office workflows to storefront experiences, this research demonstrated the importance of service design thinking at scale.
Findings were shared with product, engineering, and marketing, including the VP-level leadership, to align menu tooling improvements with broader digital transformation goals.
Internal Tools Usability Evaluation

Problem Space
Starbucks marketers rely on two key internal tools, Menu Content Builder (for print menus) and Signage Builder (for digital menu boards), to keep in-store menus accurate and up to date. These tools play a critical behind-the-scenes role, powering thousands of daily menu updates across stores nationwide.
Before evaluating usability, my first step was to uncover how marketers actually use these tools in real workflows. Through process mapping and contextual inquiry, I identified fragmented publishing flows, inconsistent workarounds, and varying levels of tool familiarity depending on team and experience. These foundational insights revealed that the process, not just the interface, was broken, creating downstream menu inaccuracies and operational inefficiencies.
Research Goals
Understand how Starbucks marketers use Menu Content Builder (MCB) for print menus and Signage Builder (SB) for digital menu boards.
Analyze current user interactions with MCB and SB to understand how different marketing roles navigate and complete publishing tasks.
Identify duplicative work and effort areas within the template and attribute management workflows.
Validate user pain points and cognitive load through benchmarking metrics (e.g., PURE scoring), establishing a measurable baseline for improvement.
Clarify the core problems to influence design priorities, ensuring future development efforts focus on foundational workflow issues rather than isolated feature fixes.
Target business outcome: Reduce the 40+ hours currently required to manage templates and attributes for menus by 50%, improving publishing efficiency and reducing operational overhead at scale.
Phase 1: User & Workflow discovery
Phase 2: Benchmarking & Quantifying pain points
Phase 3: Collaborative problem framing & ideation

Participants
To capture a representative view of how Starbucks marketers use the internal tools, I interviewed a mix of primary, secondary, and legacy users across different levels of experience and tool usage.
Primary users: These participants rely on MCB, and sometime SB, daily as a core part of their job. Their workflows offered detailed insight into publishing complexities and operational bottlenecks.
Secondary users: These were occasional users who dipped in and out of MCB and SB as needed. Their perspectives highlighted usability gaps for less frequent users and areas where onboarding or support materials were lacking.
Legacy & New users: Including both long-time users with deep institutional knowledge and newer team members with fresh perspectives helped uncover both ingrained workarounds and first-time usability friction.
Methods
Moderated interviews & Contextual inquiry
I conducted in-depth moderated interviews while observing marketers in their real working environments. This allowed me to understand diverse publishing workflows, uncover fragmented tool usage patterns, and surface pain points that weren’t visible through interface reviews alone.
PURE scoring
After synthesizing the interviews, I mapped user interactions into a scrappy end-to-end journey to pinpoint key friction points. I then applied PURE scoring (Practical Usability Rating by Experts) to each step, also bringing in two additional expert evaluators, to quantify usability challenges and surface the highest-impact areas for improvement.
System Usability Scale (SUS) survey
At the end of each session, I administered a SUS survey to 15 participants to measure perceived ease of use on a 5-point scale. These scores provided a quantitative benchmark that complemented qualitative findings and validated user pain points.


Key insight 1
Across both Menu Content Builder (MCB) and Signage Builder (SB), marketers followed inconsistent workflows shaped by their roles, tenure, and seasonal menu cycles.
This fragmentation caused duplicated work, misalignment between teams, and heavy reliance on institutional knowledge rather than standardized processes.
Key insight 2
Users frequently struggled to track panel status, locate the correct versions, and manage extensive attributes lists.
This increased cognitive load, slowed task completion, and made it difficult to ensure menu accuracy at scale.
Key insight 3
Both power users and newer marketers had created workarounds to navigate tool limitations. These workarounds compensated for missing features but also obscured some underlying process problems, which revealed that the publishing process itself needed to be fixed before focusing on new features or UI improvements.

Leading structured workshops
Grounding in real user stories
Each session began with anonymized user stories and journey maps drawn from the research. This helped participants step into marketers’ shoes and ensured that the conversations stayed anchored in real pain points, not assumptions.Mapping the end-to-end experience
We collaboratively walked through the current publishing journey, using sticky notes and digital boards to highlight friction points. This visualization helped non-marketer stakeholders (e.g., product and engineering) clearly see where systemic inefficiencies were happening.“How Might We” problem framing
I facilitated structured brainstorming using “How Might We” prompts derived from the PURE scoring insights (e.g., “How might we reduce duplicate attribute work between print and digital templates?”). This method allowed teams to frame problems in a solution-agnostic way and opened up new perspectives.Co-Ideation & Prioritization
Participants generated ideas individually and in small groups, then dot-voted on concepts with the highest potential impact and feasibility. By the end of each session, we had a clear shortlist of opportunity areas tied directly to research data.Iterative Workshop Series
Instead of a one-off event, the workshop series unfolded over three 1-hour sessions, allowing teams to digest insights, return with fresh ideas, and build momentum toward aligned problem statements and design directions.
Design opportunities
1. Streamline end-to-end workflow
3. Improve system visibility & feedback
2. Create consistent knowledge infrastructure
4. Support designers as primary SB user
Impact
Enhanced information visibility and reduced duplicative work in Menu Content Builder and Signage Builder, resulting in over 400 hours of annual time savings for marketing teams.
Lowered cognitive load and minimized error risk by improving system clarity, version tracking, and panel visibility across teams.
Shifted product and design conversations from surface-level UI fixes to strategic process alignment, ensuring foundational workflow issues were prioritized first.
Informed the future evolution of Signage Builder by emphasizing designer-centric usability improvements and tighter integration with MCB for a more seamless end-to-end publishing experience.
Set baseline (SUS, PURE) tool scoring to track improvement over time.

I’d be happy to share more about the research process! Feel free to reach out :)
2. “Sold-out” Badge Placement Testing
Context
Marketers use internal tools to manage digital menus, but usability gaps in these tools led to inconsistent “sold-out” badge placements across templates. Badge positions often shifted due to manual updates, product name lengths, and layout variations, creating unpredictable experiences for customers.
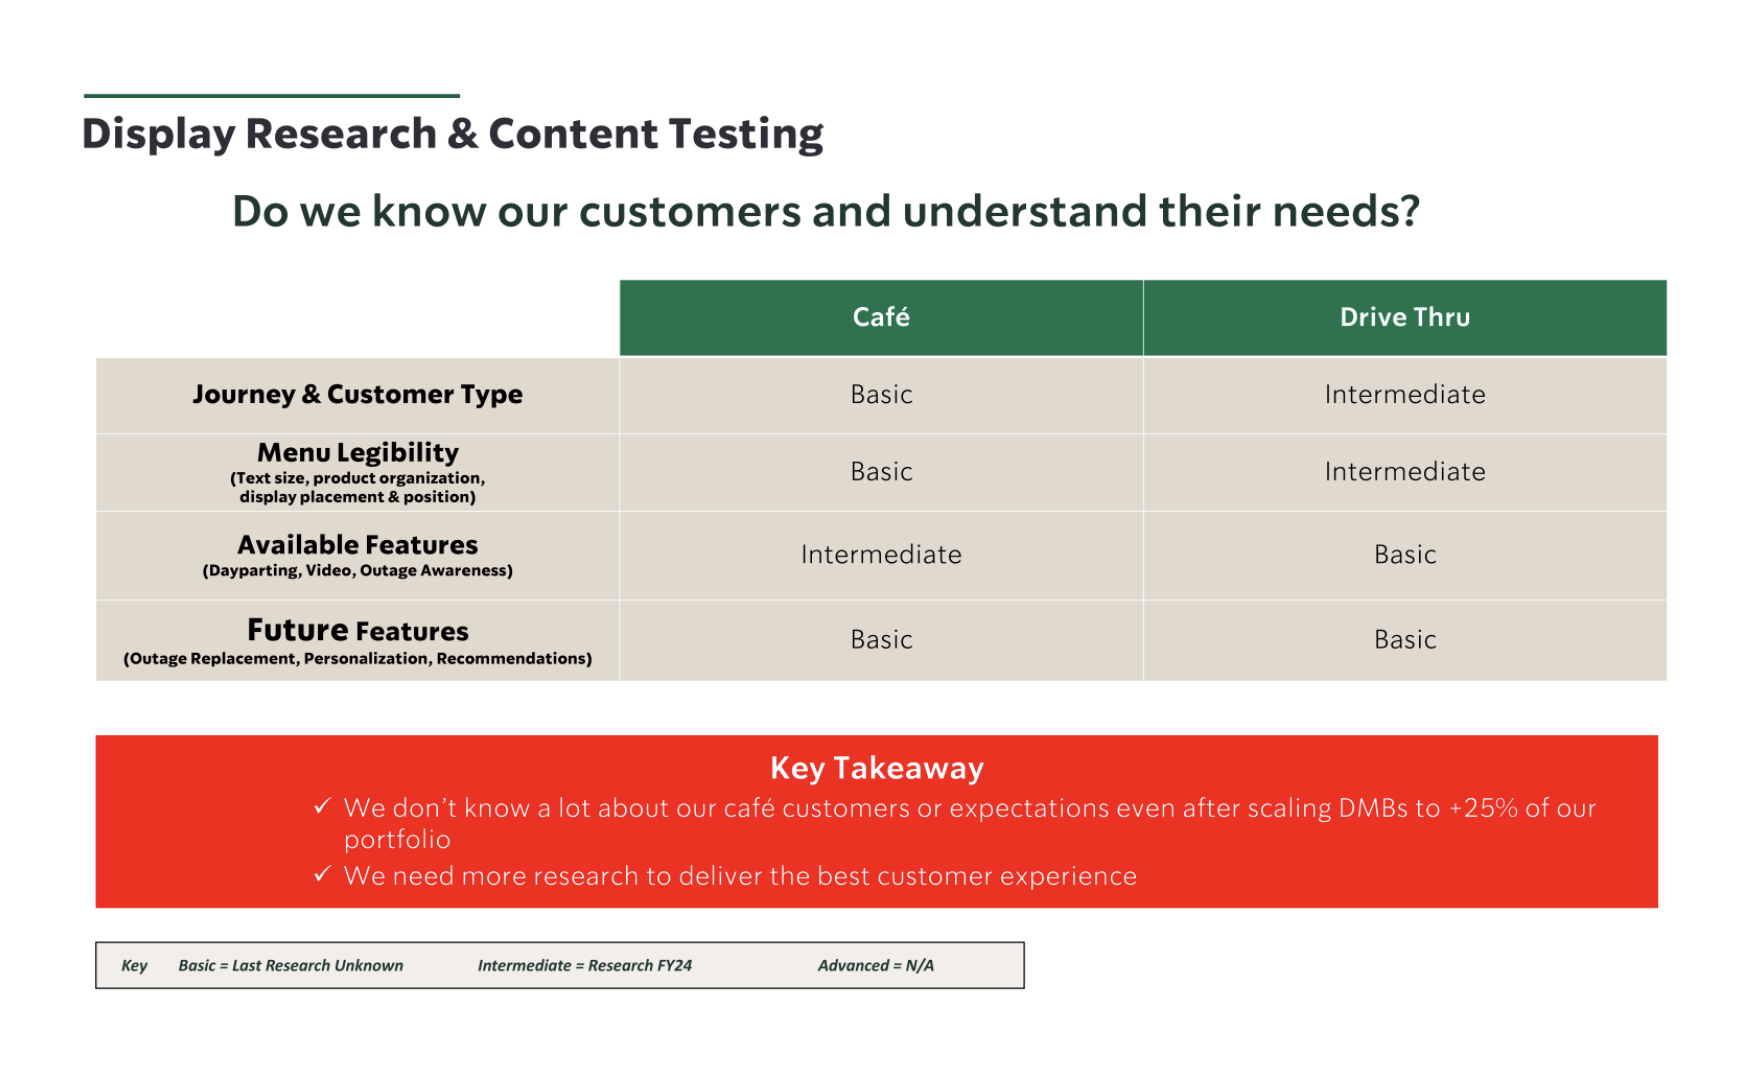
Before this study, there was little understanding of how customers actually noticed and interpreted “sold-out” badges, as past efforts focused on scaling digital boards rather than validating end-user clarity. This left both marketers and customers navigating confusing layouts, especially for irregular visitors who rely on the menu to make quick decisions.
Research Questions
How quickly do customers notice and locate “sold-out” badges across different menu layouts?
Which badge placement communicates availability status most clearly and efficiently?
How do variations in badge placement affect information hierarchy and menu scan patterns?
What context or details (e.g., price, calories, restock expectations) do customers still want when an item is sold out?
How might inconsistent badge placement stemming from internal tool workflows impact customer decision-making and trust?
*Menu A, B, C Prototypes
Moderated user interviews
Participants
We conducted 12 remote user interviews with Starbucks customers to understand how they perceive “sold-out” badges on digital menu boards.
6 Regular customers
Visit Starbucks 3+ times per week
Familiar with the menu and rely less on the board for decision-making
6 Irregular customers
Visit 1-2 times per month
Depend heavily on menu clarity when ordering in-store
Participants ranged in age from 23 to 54, with a mix of shopping center and standalone store visitors to reflect different in-store contexts.
Research process
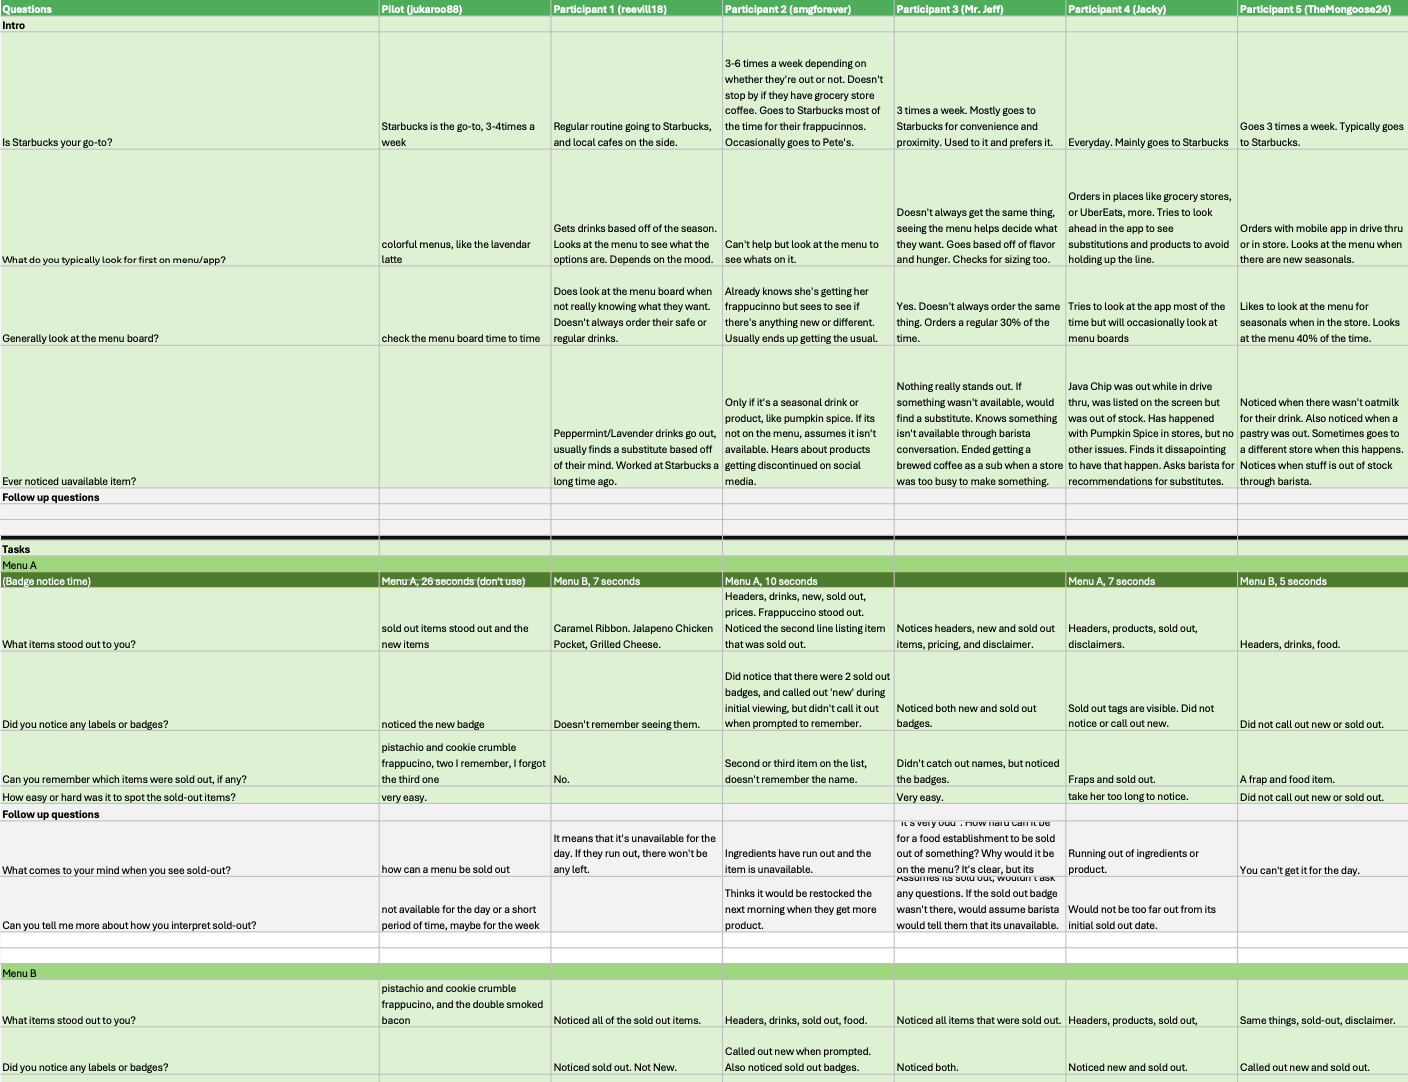
The study consisted of 20-30minute moderated remote interviews conducted via UserTesting. Participants were shown three digital menu board variations and asked to review and compare menus while thinking aloud.
Noticed and interpreted “sold-out” badges
Scanned the menu to locate unavailable items
Reacted to different badge placements and information hierarchies
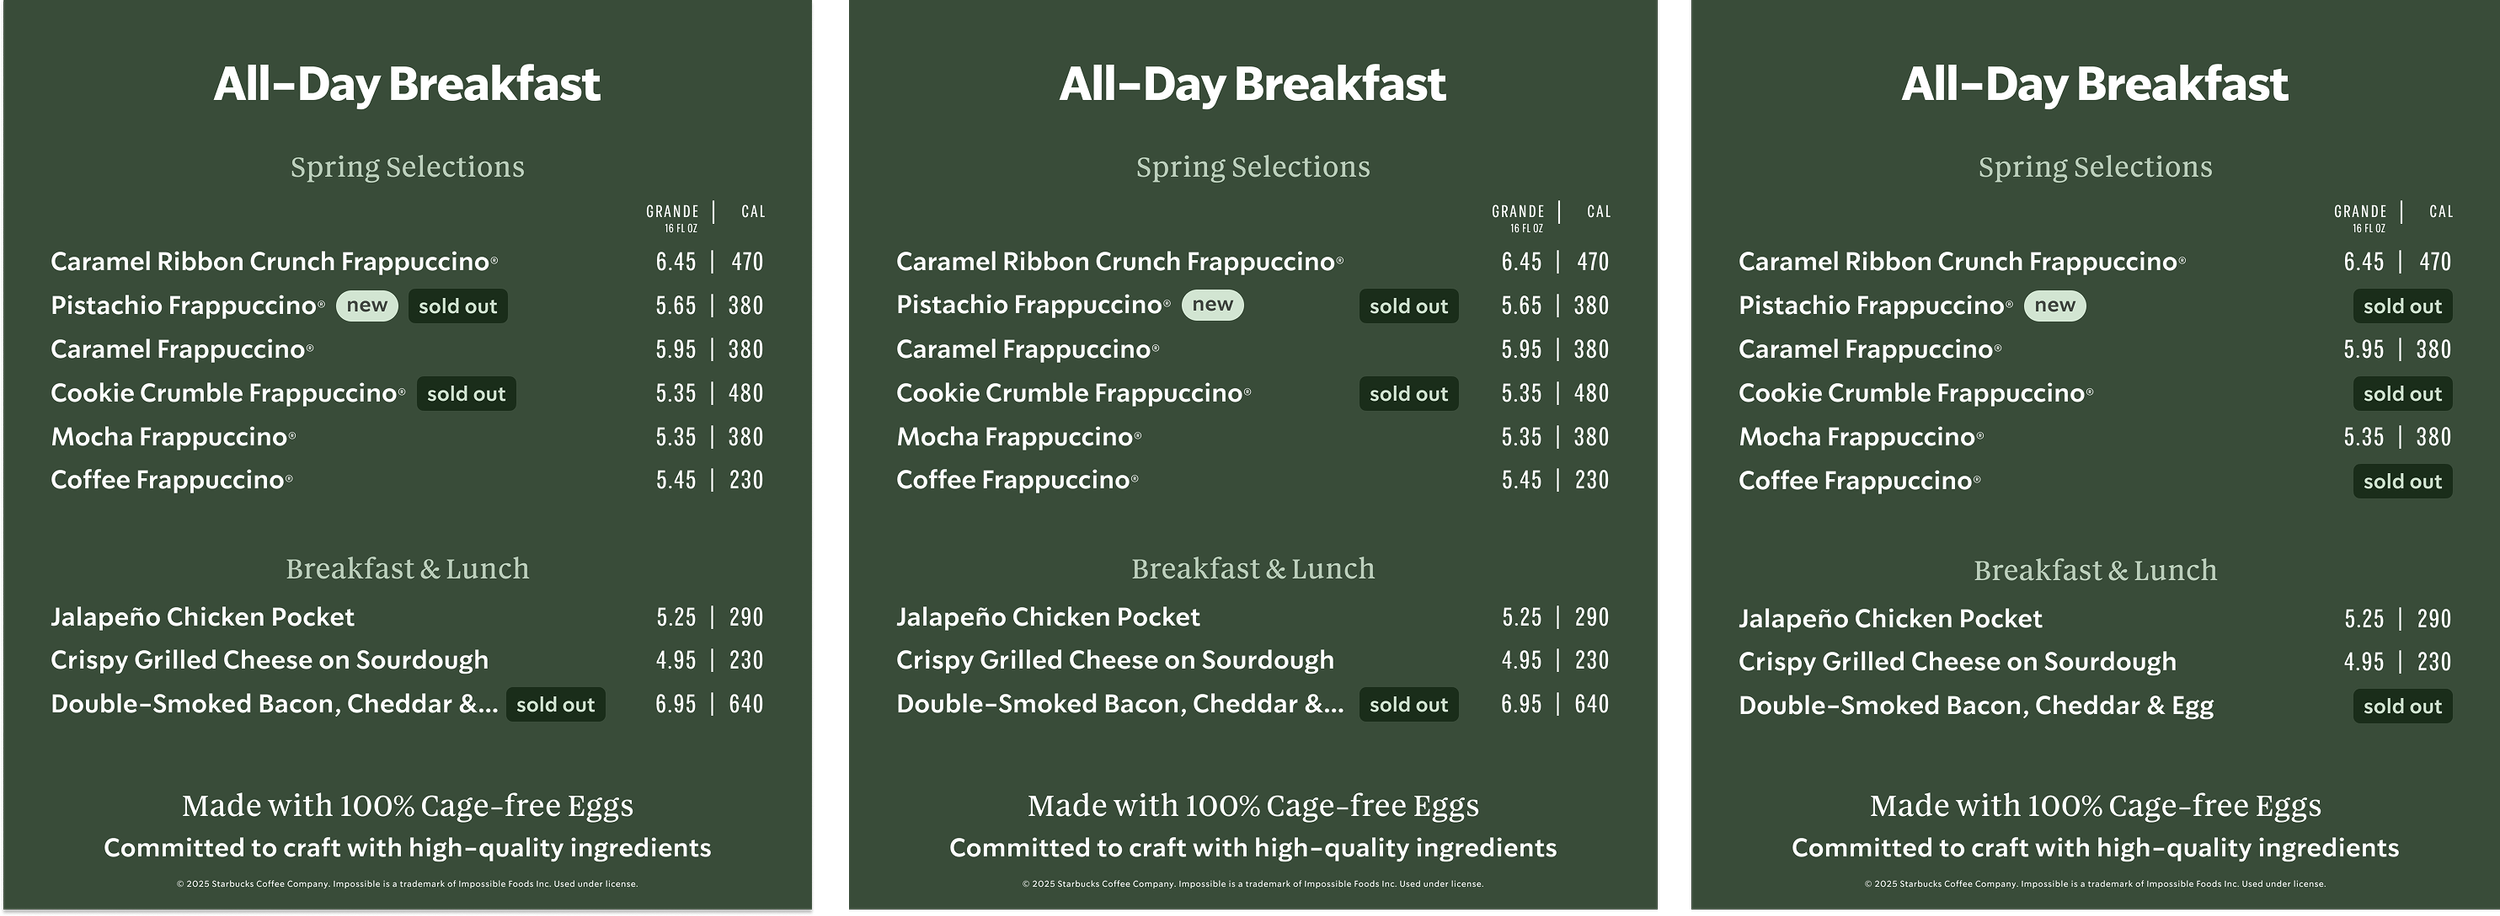
The three menu variations tested were:
Menu A: Badge next to the product name
Menu B: Badge right-aligned (next to price/calories)
Menu C: Badge replacing price/calorie information
Data synthesis
After the sessions, we mapped user interactions and feedback across the three menu variations to uncover usability patterns. Key moments (e.g., how quickly participants noticed badges, where their attention went first, and what caused confusion) were systematically compared.
We synthesized findings to:
Identify the most effective badge placement for quick recognition and clarity
Quantify usability challenges (e.g., delayed recognition, misinterpretation)
Inform design decisions for standardizing sold-out badge placement in future menu templates
This structured synthesis helped connect customer insights back to internal publishing workflows, ensuring design recommendations could be realistically implemented through Signage Builder for digital menus.
Findings 1
Right-aligned placement improved clarity. Menu B’s layout allowed users to spot “sold-out” items quickly without losing key details like price or calories.
Findings 2
Consistent placement accelerated recognition. Predictable badge positioning helped users scan efficiently, while shifts due to long product names slowed them down.
Findings 4
Irregular customers were most impacted by unclear layouts. They depend heavily on menu clarity to make quick decisions, making consistent badge placement especially critical.
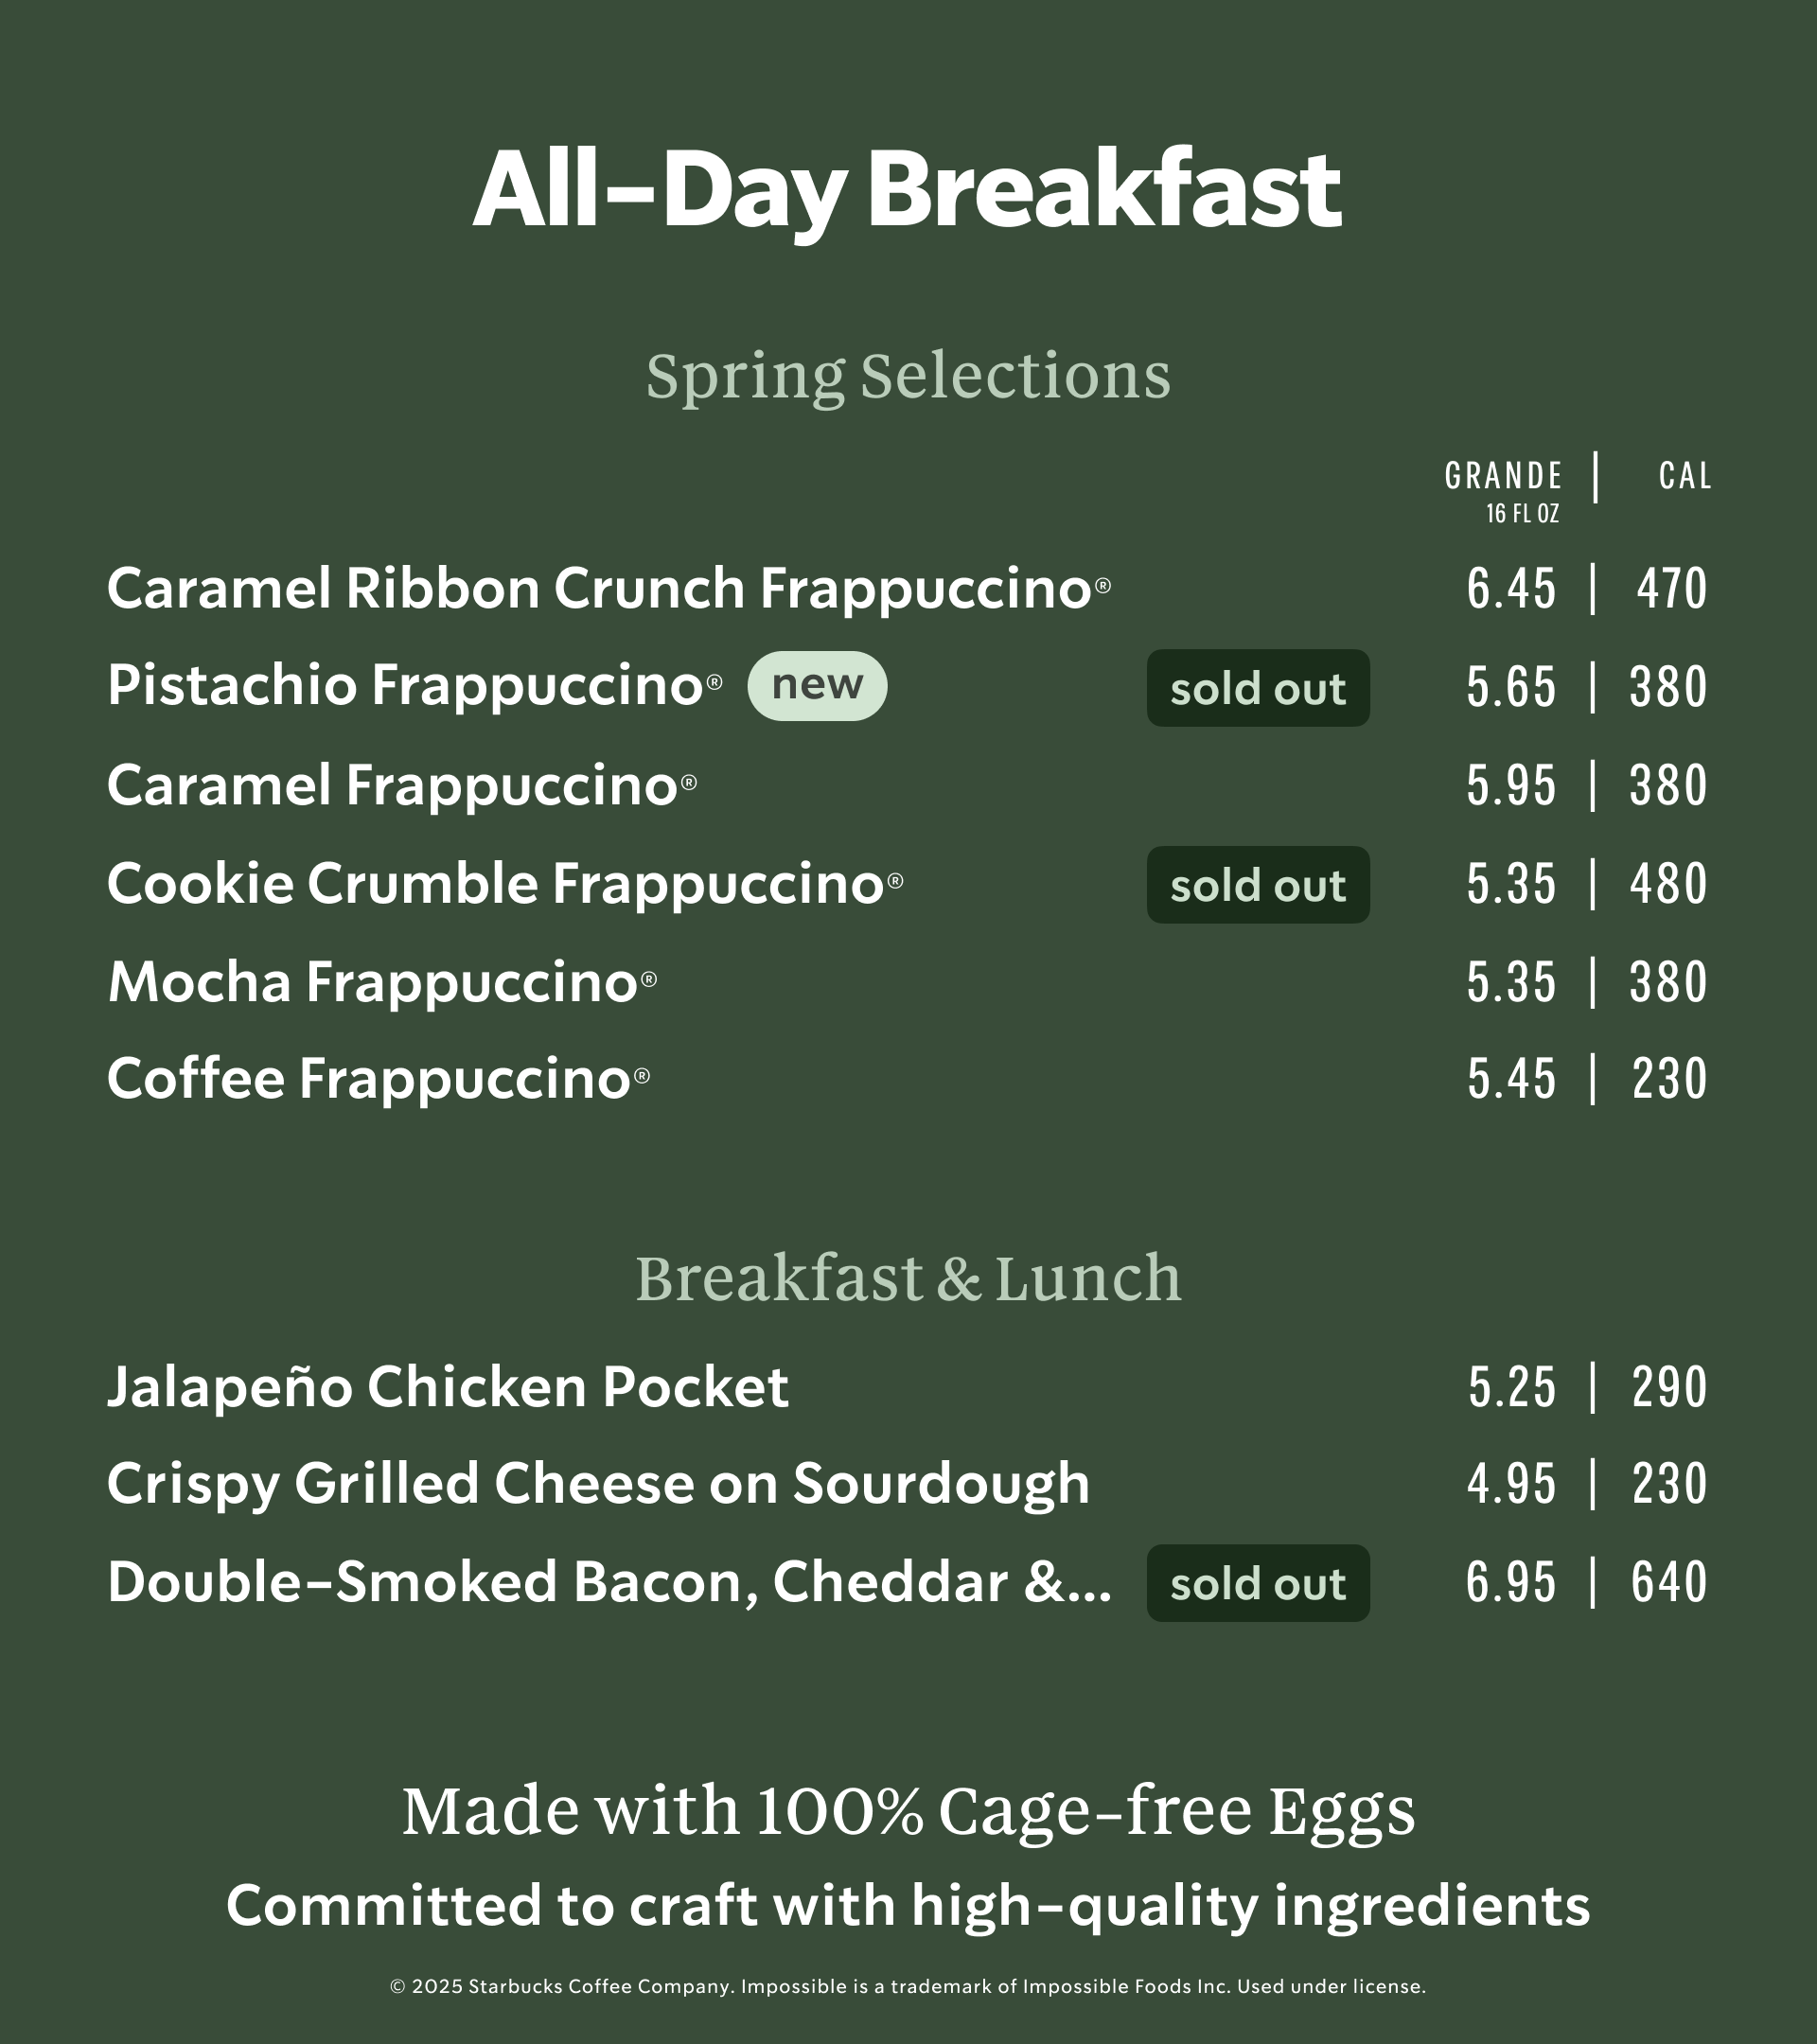
Findings 3
Hiding price and calories created confusion. Replacing this information (Menu C) disrupted the expected hierarchy, leading to hesitation and frustration.
Outcome
The research provided clear evidence to standardize “sold-out” badge placement on digital menu boards, directly informing Starbucks’ menu design strategy. Menu B’s right-aligned layout was adopted as the baseline template, ensuring consistent badge positioning without hiding critical price or calorie information.
We were able to launch the updated badge placement live on digital menus across 15,000+ store locations, improving clarity and consistency across thousands of stores. Early feedback from field teams and customers has been positive, with fewer reports of confusion around unavailable items. This work also influenced internal Signage Builder workflows, reducing layout inconsistencies and enabling more reliable menu updates at scale.


Reflection
Looking back, a few things really stood out across both studies. First, the cross-functional collaboration was seamless; research, design, product, and marketing were all aligned on goals and next steps from the start, which made the process feel focused and efficient. We also set clear objectives early on, so everyone knew what success looked like. The prototype discussions were especially productive, sparking thoughtful conversations about how internal workflows connect to real customer experiences. It was exciting to see how insights from tool usability testing directly informed downstream menu design decisions.
If we were to run these studies again, we’d love to bring more in-person research into stores to capture real behaviors in context. Expanding the participant mix to include different store formats would also give us a richer perspective. Another opportunity is to tighten the prototype iteration loop, so we can explore and refine variations more quickly. And finally, involving field and operations partners earlier would help us anticipate rollout needs and make implementation even smoother.